Best Bitcoin Indicators to Watch for Smarter Trading Decisions
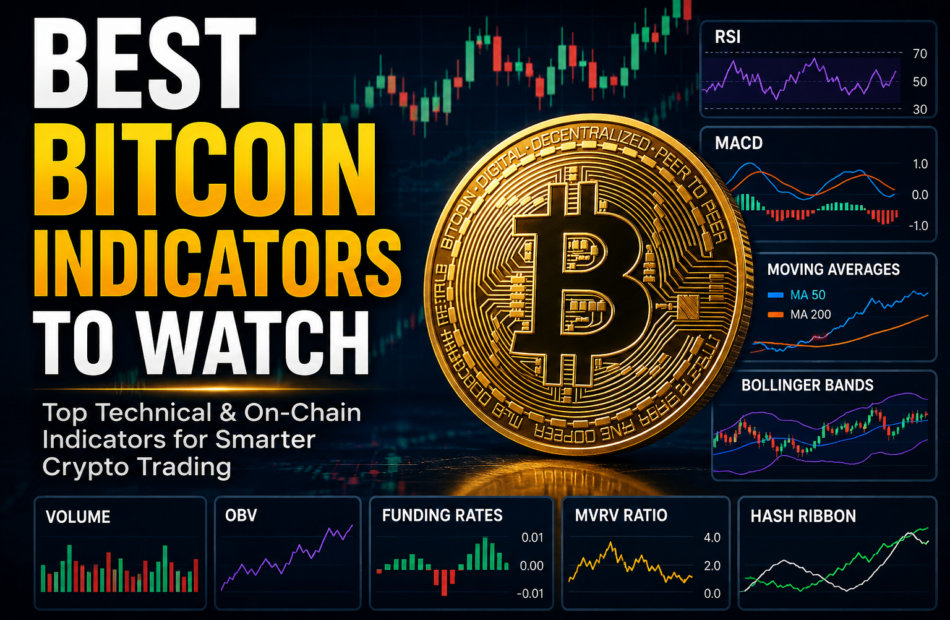
The best bitcoin indicators to watch include RSI, Moving Averages, MACD, Bollinger Bands, On-Balance Volume, Funding Rates, and Bitcoin-specific on-chain metrics. These indicators help traders identify trends, momentum, market sentiment, support and resistance levels, and potential reversals. Using multiple indicators together can improve decision-making and reduce the risk of false signals in volatile cryptocurrency markets.
INTRODUCTION
Bitcoin remains the most closely watched asset in the cryptocurrency market. However, its price can move rapidly, making it difficult for traders and investors to identify the right entry and exit points. This is why understanding the best bitcoin indicators to watch is essential for anyone looking to navigate market volatility with greater confidence.
Technical indicators and on-chain metrics provide valuable insights into market trends, momentum, sentiment, and potential price reversals. While no indicator guarantees success, combining several reliable tools can significantly improve your decision-making process.
This guide covers the most effective Bitcoin indicators, explains how they work, and shows how traders use them to analyze the market from both short-term and long-term perspectives.
Why Bitcoin Indicators Matter
Bitcoin trades 24/7 and is influenced by multiple factors, including:
- Market sentiment
- Institutional adoption
- Macroeconomic conditions
- Regulatory developments
- Supply and demand dynamics
- Blockchain activity
Because of these factors, traders rely on indicators to:
- Identify trends
- Measure momentum
- Spot potential reversals
- Manage risk
- Confirm trading signals
Instead of relying on emotions, indicators help traders make more objective decisions.
Quick Comparison of the Best Bitcoin Indicators
| Indicator | Purpose | Best For |
|---|---|---|
| RSI | Momentum measurement | Overbought and oversold conditions |
| Moving Averages | Trend identification | Trend-following strategies |
| MACD | Trend and momentum | Entry and exit signals |
| Bollinger Bands | Volatility analysis | Breakouts and reversals |
| Volume Indicator | Market participation | Trend confirmation |
| OBV | Volume flow tracking | Price movement validation |
| Funding Rates | Market sentiment | Futures analysis |
| MVRV Ratio | On-chain valuation | Long-term Bitcoin cycles |
| Puell Multiple | Miner behavior | Market tops and bottoms |
| Hash Ribbon | Miner capitulation | Long-term accumulation zones |
Relative Strength Index (RSI)
The Relative Strength Index is one of the most popular momentum indicators in cryptocurrency trading.
RSI measures the speed and magnitude of price movements on a scale from 0 to 100.
How RSI Works
- Above 70 = Potentially overbought
- Below 30 = Potentially oversold
- Around 50 = Neutral momentum
Example
If Bitcoin’s RSI rises above 70 after a strong rally, it may indicate that buyers are becoming exhausted. Conversely, an RSI below 30 could suggest a potential buying opportunity.
Why Traders Use RSI
- Easy to understand
- Effective for spotting momentum shifts
- Useful in both bull and bear markets
Moving Averages (MA)
Moving averages remain among the best bitcoin indicators to watch because they help identify overall market direction.
Common Moving Averages
- 50-Day Moving Average
- 100-Day Moving Average
- 200-Day Moving Average
Key Signals
Golden Cross
Occurs when the 50-day moving average crosses above the 200-day moving average.
This is generally considered bullish.
Death Cross
Occurs when the 50-day moving average falls below the 200-day moving average.
This is often considered bearish.
Benefits
- Filters market noise
- Highlights long-term trends
- Widely used by institutional traders
Moving Average Convergence Divergence (MACD)
MACD combines trend and momentum analysis into one indicator.
It consists of:
- MACD line
- Signal line
- Histogram
Bullish Signal
When the MACD line crosses above the signal line.
Bearish Signal
When the MACD line crosses below the signal line.
Why MACD Is Valuable
MACD helps traders identify trend changes before they become obvious on the price chart.
As a result, many Bitcoin traders use MACD alongside RSI for confirmation.
Bollinger Bands
Bollinger Bands measure market volatility.
The indicator includes:
- Middle moving average
- Upper band
- Lower band
What It Shows
When the bands widen:
- Volatility is increasing
When the bands contract:
- Volatility is decreasing
Trading Insights
A breakout above the upper band can indicate strong bullish momentum.
Meanwhile, a move below the lower band may signal increased selling pressure.
Because Bitcoin often experiences explosive price moves, Bollinger Bands can be especially useful for spotting breakout opportunities.
Trading Volume
Volume is one of the simplest yet most important indicators.
It measures how much Bitcoin is being bought and sold during a specific period.
Why Volume Matters
Price movements backed by strong volume are generally considered more reliable.
For example:
- Rising price + rising volume = Strong trend
- Rising price + weak volume = Potential weakness
Practical Use
Before entering a trade, experienced traders often check whether volume confirms the move.
On-Balance Volume (OBV)
OBV combines price action and trading volume.
The indicator adds volume on up days and subtracts volume on down days.
What OBV Reveals
OBV helps identify whether money is flowing into or out of Bitcoin.
Bullish Signal
If Bitcoin’s price remains flat while OBV rises, accumulation may be occurring behind the scenes.
Bearish Signal
If price rises while OBV falls, the rally may lack strong support.
Funding Rates
Funding rates are crucial for traders participating in Bitcoin futures markets.
Positive Funding Rate
Long traders pay short traders.
This often indicates bullish sentiment.
Negative Funding Rate
Short traders pay long traders.
This can indicate bearish sentiment.
Why It Matters
Extremely high funding rates may signal excessive optimism.
Likewise, extremely negative funding rates can indicate fear and potential market bottoms.
Funding rates are often used as contrarian indicators.
MVRV Ratio
The Market Value to Realized Value (MVRV) Ratio is one of the most respected Bitcoin on-chain indicators.
What It Measures
MVRV compares:
- Current market value
- Realized value of all Bitcoin in circulation
Interpretation
High MVRV values:
- Potential market overheating
- Possible cycle top
Low MVRV values:
- Potential undervaluation
- Historical accumulation zones
Long-term investors frequently monitor this metric when evaluating Bitcoin’s position within larger market cycles.
Puell Multiple
The Puell Multiple focuses on Bitcoin miner revenue.
Why Miners Matter
Miners are responsible for securing the Bitcoin network.
Their behavior often influences market dynamics.
Bull Market Warning
When miner revenues become exceptionally high, market tops may be approaching.
Bear Market Opportunity
Historically low miner revenues have often coincided with attractive accumulation periods.
Hash Ribbon Indicator
Hash Ribbon tracks changes in Bitcoin mining activity.
Core Concept
The indicator identifies periods of miner capitulation.
Miner capitulation occurs when mining becomes unprofitable and some miners shut down operations.
Why Investors Watch It
Historically, Hash Ribbon buy signals have appeared near major Bitcoin market bottoms.
As a result, long-term investors often use this indicator to identify accumulation opportunities.
Fear and Greed Index
Although technically not a chart indicator, the Crypto Fear and Greed Index provides valuable sentiment analysis.
Fear
- Panic selling
- Market uncertainty
- Potential buying opportunities
Greed
- Excessive optimism
- Increased speculation
- Potential correction risk
This indicator helps investors understand emotional extremes in the market.
Combining Indicators for Better Accuracy
No single indicator works perfectly.
Successful traders typically combine multiple tools.
Example Strategy
Trend Analysis:
- 200-Day Moving Average
Momentum:
- RSI
- MACD
Confirmation:
- Volume
- OBV
Sentiment:
- Funding Rates
- Fear and Greed Index
On-Chain Analysis:
- MVRV Ratio
- Hash Ribbon
This multi-layered approach reduces false signals and improves confidence.
Common Mistakes When Using Bitcoin Indicators
Using Only One Indicator
Relying on a single metric can lead to poor decisions.
Ignoring Market Context
Indicators should be combined with broader market analysis.
Overtrading
Not every signal deserves action.
Patience remains one of the most important trading skills.
Chasing Lagging Signals
Many indicators are based on historical data.
Therefore, traders should use them as guidance rather than guarantees.
Which Bitcoin Indicator Is Best for Beginners?
For beginners, the most practical indicators include:
- RSI
- Moving Averages
- MACD
- Volume Analysis
These indicators are widely available, easy to understand, and effective for learning market behavior.
As experience grows, traders can incorporate advanced on-chain metrics such as MVRV, Puell Multiple, and Hash Ribbon.
Related Bitcoin Indicators and Metrics Worth Monitoring
Beyond the major indicators discussed above, traders often track:
- Bitcoin dominance
- Open interest
- Exchange inflows and outflows
- Stablecoin reserves
- Realized price
- Stock-to-flow model
- Network value to transactions ratio (NVT)
- Active wallet addresses
- Long-term holder supply
- Short-term holder supply
Together, these metrics provide a deeper understanding of Bitcoin’s market structure.
Frequently Asked Questions
What are the best bitcoin indicators to watch for beginners?
RSI, Moving Averages, MACD, and Volume Analysis are generally considered the best starting indicators because they are easy to understand and widely used.
Which indicator predicts Bitcoin price most accurately?
No indicator predicts Bitcoin prices perfectly. Combining RSI, MACD, Moving Averages, and on-chain metrics typically produces better results than relying on one indicator.
Is RSI good for Bitcoin trading?
Yes. RSI helps identify overbought and oversold conditions, making it useful for spotting potential reversals and momentum changes.
What is the best on-chain Bitcoin indicator?
Many analysts consider the MVRV Ratio and Hash Ribbon among the most reliable on-chain indicators for identifying long-term market cycles.
How many indicators should I use?
Most traders use between three and five complementary indicators to avoid information overload while still gaining multiple perspectives.
Do professional traders use Bitcoin indicators?
Yes. Professional traders, hedge funds, and institutional investors frequently use technical indicators alongside macroeconomic and on-chain analysis.
Can indicators guarantee profits?
No. Indicators are analytical tools that improve decision-making, but they cannot eliminate risk or guarantee successful trades.
Conclusion
Understanding the best bitcoin indicators to watch can dramatically improve your ability to analyze market conditions, identify trends, and manage risk effectively. Indicators such as RSI, Moving Averages, MACD, Bollinger Bands, Volume, MVRV Ratio, and Hash Ribbon each provide unique insights into Bitcoin’s behavior.
The most successful investors do not rely on a single signal. Instead, they combine technical analysis, market sentiment, and on-chain data to build a more complete view of the market.
At The Crypto Investors, we provide in-depth Bitcoin analysis, educational resources, market insights, and expert guidance to help investors make informed decisions in an evolving crypto landscape. Explore more of our Bitcoin strategy guides and stay ahead of the market with research-driven insights.