
Bitcoin Market Sentiment Indicators: The Complete Guide for Smarter Crypto Investing
Bitcoin Market Sentiment Indicators: The Complete Guide for Smarter Crypto Investing
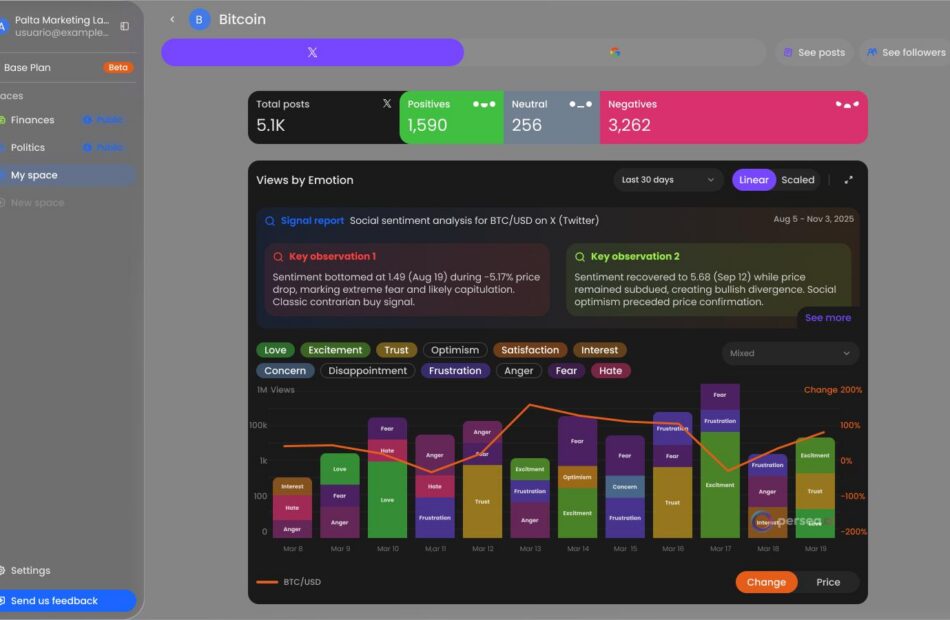
Bitcoin market sentiment indicators help investors understand whether the market is driven by fear, greed, optimism, or panic. By analyzing metrics such as the Fear and Greed Index, funding rates, social sentiment, MVRV ratio, and on-chain data, traders can identify potential market tops, bottoms, and trend reversals. These indicators are most effective when combined with technical and fundamental analysis rather than used in isolation.
Introduction
Bitcoin is often called a technology-driven asset, but market psychology plays an equally important role in determining its price. Fear, greed, optimism, panic, and investor confidence can create powerful trends that drive Bitcoin higher or lower.
This is where bitcoin market sentiment indicators become valuable. These tools help investors measure the overall mood of the market and identify whether participants are becoming excessively bullish or bearish.
Whether you’re a beginner investor, active trader, or long-term Bitcoin holder, understanding market sentiment can help you make more informed decisions, avoid emotional mistakes, and potentially identify buying or selling opportunities before the crowd reacts.
What Are Bitcoin Market Sentiment Indicators?
Bitcoin market sentiment indicators are tools and metrics used to gauge investor emotions, market confidence, and overall psychological conditions within the cryptocurrency market.
Unlike traditional technical indicators that focus on price and volume, sentiment indicators measure how investors feel about Bitcoin.
These indicators analyze data from:
- Social media platforms
- On-chain blockchain activity
- Derivatives markets
- Search trends
- Investor behavior
- Exchange flows
- Market positioning
When used correctly, sentiment indicators can provide early signals of:
- Market tops
- Market bottoms
- Trend reversals
- Investor capitulation
- Bull market acceleration
- Bear market exhaustion
Why Market Sentiment Matters in Bitcoin
Bitcoin is one of the most emotionally driven financial assets in the world.
Several factors contribute to this:
| Factor | Impact on Sentiment |
|---|---|
| High Volatility | Creates fear and greed cycles |
| Media Coverage | Influences investor behavior |
| Social Media | Amplifies market emotions |
| Limited Supply | Creates scarcity narratives |
| Speculation | Drives rapid sentiment shifts |
| Global Adoption News | Triggers bullish or bearish reactions |
Market sentiment often reaches extremes before major price reversals occur.
As legendary investor Warren Buffett once noted:
Be fearful when others are greedy and greedy when others are fearful.
This principle applies strongly to Bitcoin markets.
Bitcoin Fear and Greed Index
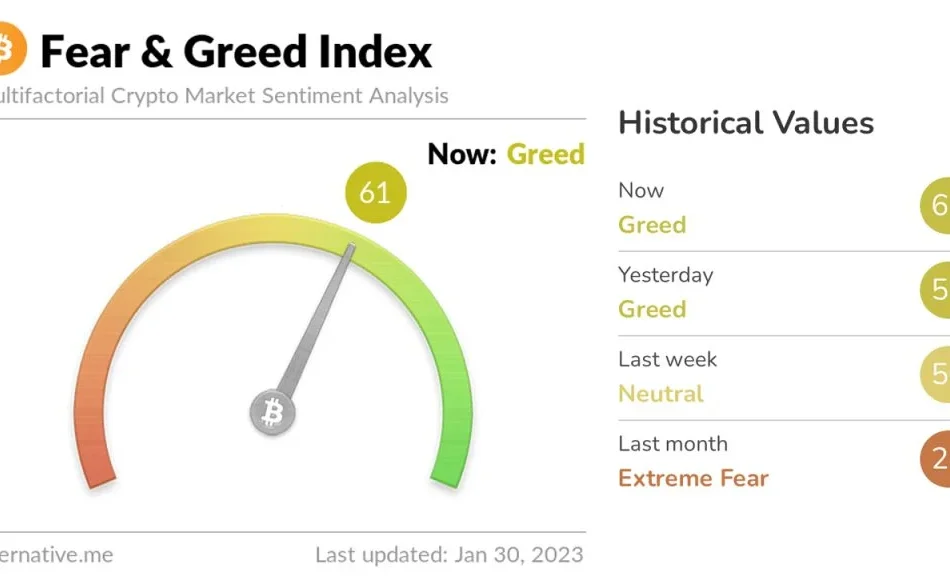
The Fear and Greed Index is one of the most popular bitcoin market sentiment indicators.
It measures investor emotions on a scale from 0 to 100.
| Score | Sentiment |
|---|---|
| 0-24 | Extreme Fear |
| 25-49 | Fear |
| 50 | Neutral |
| 51-74 | Greed |
| 75-100 | Extreme Greed |
How It Works
The index analyzes:
- Volatility
- Trading volume
- Social media activity
- Market momentum
- Bitcoin dominance
- Search trends
How Investors Use It
Extreme Fear:
- May signal undervaluation
- Often appears near market bottoms
- Potential accumulation opportunity
Extreme Greed:
- May signal overvaluation
- Often appears near market tops
- Risk management becomes important
Social Media Sentiment Analysis
Social media has become a major force in cryptocurrency markets.
Platforms such as:
- X (Twitter)
- Telegram
- Discord
- YouTube
can significantly influence investor behavior.
Key Signals to Monitor
Positive indicators:
- Increasing bullish discussions
- Growing Bitcoin adoption conversations
- Rising influencer engagement
Negative indicators:
- Panic selling discussions
- Excessive fear
- FUD (Fear, Uncertainty, and Doubt)
Benefits
Social sentiment can often shift before price movements occur, providing valuable early insights.
Bitcoin Funding Rates
Funding rates are among the most effective sentiment indicators used by professional traders.
They reflect positioning in perpetual futures markets.
Positive Funding Rates
When funding rates are highly positive:
- Most traders are long
- Market sentiment is bullish
- Overcrowded positions may exist
Negative Funding Rates
When funding rates turn deeply negative:
- Traders are bearish
- Short positions dominate
- Potential short squeeze conditions may develop
Practical Insight
Extremely high funding rates frequently appear near local tops, while deeply negative rates often emerge near market bottoms.
MVRV Ratio
The Market Value to Realized Value (MVRV) Ratio is a powerful on-chain sentiment metric.
Formula
MVRV Ratio = Market Cap ÷ Realized Cap
What It Measures
It shows whether Bitcoin holders are:
- Sitting on large profits
- Holding losses
- Near breakeven
Interpretation
| MVRV Level | Meaning |
|---|---|
| Above 3.5 | Potential market top |
| Around 1 | Fair value |
| Below 1 | Potential market bottom |
The MVRV ratio has historically helped identify major Bitcoin cycle turning points.
Bitcoin Exchange Flows
Exchange flow analysis measures Bitcoin moving onto and off exchanges.
Exchange Inflows
Large inflows may indicate:
- Increased selling pressure
- Profit-taking activity
- Bearish sentiment
Exchange Outflows
Large outflows may suggest:
- Long-term accumulation
- Investor confidence
- Reduced sell pressure
Many institutional investors monitor exchange flow data as part of their market sentiment analysis.
Stablecoin Supply Ratio (SSR)
The Stablecoin Supply Ratio compares Bitcoin market capitalization to stablecoin liquidity.
Why It Matters
Stablecoins often represent buying power waiting on the sidelines.
Lower SSR
- More stablecoin liquidity available
- Potential bullish environment
- Increased purchasing power
Higher SSR
- Reduced available liquidity
- Potential bearish conditions
This metric helps assess market readiness for future Bitcoin demand.
Google Trends Data
Search activity can reveal changing investor interest.
Bullish Signals
Increasing searches for:
- Buy Bitcoin
- Bitcoin ETF
- Bitcoin price prediction
- Bitcoin investment
Bearish Signals
Decreasing search volume often indicates reduced enthusiasm and investor participation.
Historical Observation
Major search spikes have frequently coincided with Bitcoin market peaks.
Bitcoin Dominance
Bitcoin Dominance measures Bitcoin’s share of the total cryptocurrency market.
Rising Dominance
May indicate:
- Investor preference for safety
- Strong Bitcoin sentiment
- Capital flowing from altcoins into Bitcoin
Falling Dominance
May indicate:
- Increased risk appetite
- Altcoin speculation
- Changing market leadership
Bitcoin dominance provides valuable context when evaluating broader crypto market sentiment.
Open Interest Analysis
Open Interest tracks the total value of active futures contracts.
Rising Open Interest + Rising Price
Usually indicates:
- Strong bullish conviction
- Trend continuation potential
Rising Open Interest + Falling Price
May indicate:
- Growing bearish sentiment
- Increased short positioning
Falling Open Interest
Often signals:
- Reduced speculation
- Position liquidations
- Market cooling
Combining Multiple Sentiment Indicators
No single indicator should be used in isolation.
The most effective investors combine several indicators to build a complete market picture.
Example Bullish Setup
- Fear and Greed Index in Extreme Fear
- Negative funding rates
- Bitcoin leaving exchanges
- MVRV near historical lows
- Stablecoin liquidity increasing
This combination may suggest a potential accumulation opportunity.
Example Bearish Setup
- Extreme Greed reading
- Excessively positive funding rates
- Massive social media hype
- MVRV above historical averages
- Sharp increase in exchange inflows
This combination may indicate elevated market risk.
Common Mistakes When Using Sentiment Indicators
Following One Metric Blindly
Markets are complex. Always combine multiple indicators.
Ignoring Broader Market Conditions
Macroeconomic events, interest rates, and ETF flows can override sentiment signals.
Acting Emotionally
Sentiment indicators should guide decisions, not replace risk management.
Chasing Hype
Excessive optimism often appears near market peaks.
Best Bitcoin Market Sentiment Indicators Ranked
| Indicator | Reliability | Use Case |
|---|---|---|
| Fear and Greed Index | High | Market psychology |
| Funding Rates | High | Trader positioning |
| MVRV Ratio | Very High | Cycle analysis |
| Exchange Flows | High | Supply dynamics |
| Open Interest | High | Futures sentiment |
| Social Sentiment | Medium | Crowd behavior |
| Google Trends | Medium | Retail interest |
| Bitcoin Dominance | Medium | Market structure |
How Long-Term Investors Can Use Sentiment Indicators
Long-term Bitcoin investors can use sentiment data to improve accumulation strategies.
Rather than attempting to time every market move:
- Monitor fear levels.
- Track on-chain metrics.
- Watch exchange outflows.
- Evaluate funding rates.
- Increase research during periods of extreme pessimism.
This disciplined approach often leads to better decision-making than reacting emotionally to short-term price fluctuations.
Frequently Asked Questions
What are bitcoin market sentiment indicators?
Bitcoin market sentiment indicators are tools that measure investor emotions, market confidence, and behavioral trends to help identify potential buying and selling opportunities.
Which sentiment indicator is best for Bitcoin?
The Fear and Greed Index, MVRV Ratio, funding rates, and exchange flow metrics are among the most widely used and reliable Bitcoin sentiment indicators.
Can sentiment indicators predict Bitcoin price?
No indicator can predict prices with certainty. However, sentiment indicators can help identify periods of excessive optimism or pessimism that often precede major market moves.
What does Extreme Fear mean in Bitcoin?
Extreme Fear suggests investors are highly cautious or panic-selling. Historically, these periods have often provided attractive long-term buying opportunities.
What does Extreme Greed mean in Bitcoin?
Extreme Greed indicates excessive optimism and speculative behavior. It may signal increased risk and possible market overheating.
Why are funding rates important?
Funding rates reveal trader positioning in futures markets and can help identify overcrowded bullish or bearish trades.
Should beginners use market sentiment indicators?
Yes. Beginners can benefit from understanding market psychology and avoiding emotional decisions by incorporating sentiment indicators into their research process.
Conclusion
Understanding bitcoin market sentiment indicators can provide a significant advantage in today’s fast-moving cryptocurrency markets. Metrics such as the Fear and Greed Index, MVRV Ratio, funding rates, exchange flows, open interest, and social sentiment help investors understand what is driving market behavior beneath the surface.
While no indicator is perfect, combining multiple sentiment signals can improve risk management, identify potential opportunities, and help investors avoid emotional decision-making.
At The Crypto Investors, we regularly publish in-depth Bitcoin analysis, on-chain research, market cycle insights, and cryptocurrency investment strategies designed to help investors navigate the digital asset landscape with greater confidence. Explore our latest resources and stay ahead of emerging Bitcoin market trends.

How to Dollar Cost Average Into Bitcoin: A Complete Beginner-to-Advanced Guide
How to Dollar Cost Average Into Bitcoin: A Complete Beginner-to-Advanced Guide
Dollar Cost Averaging (DCA) into Bitcoin is an investment strategy where you invest a fixed amount of money at regular intervals regardless of price. This approach reduces the impact of market volatility, removes emotional decision-making, and helps investors accumulate Bitcoin steadily over time. For beginners and long-term investors alike, DCA is one of the safest and most effective ways to build a Bitcoin position.
Introduction
If you’re wondering how to dollar cost average into Bitcoin, you’re not alone. Many investors want exposure to Bitcoin but struggle with one major question: When is the right time to buy?
The truth is that timing the Bitcoin market consistently is nearly impossible—even for experienced traders. Bitcoin’s price can rise or fall dramatically within days, making emotional decisions costly.
That’s where Dollar Cost Averaging (DCA) comes in. Instead of trying to predict market tops and bottoms, DCA allows you to invest a fixed amount at regular intervals, helping you reduce risk and build a long-term Bitcoin position with confidence.
In this guide, you’ll learn exactly how DCA works, why it is popular among Bitcoin investors, how to create your own strategy, and common mistakes to avoid.
What Is Dollar Cost Averaging (DCA)?
Dollar Cost Averaging is an investment strategy where you invest a fixed amount of money on a consistent schedule regardless of Bitcoin’s current price.
For example:
| Week | Bitcoin Price | Amount Invested | BTC Purchased |
|---|---|---|---|
| Week 1 | $100,000 | $100 | 0.001 BTC |
| Week 2 | $90,000 | $100 | 0.00111 BTC |
| Week 3 | $80,000 | $100 | 0.00125 BTC |
| Week 4 | $110,000 | $100 | 0.00091 BTC |
Over time, your average purchase price becomes smoother than trying to buy all at once.
This strategy is widely used in stock investing, retirement planning, index funds, and cryptocurrency investing.
Why Investors Use DCA for Bitcoin
Bitcoin is known for its volatility. Prices can swing 10%–20% in a matter of days.
Instead of worrying about short-term fluctuations, DCA helps investors focus on long-term accumulation.
Key Benefits of Bitcoin DCA
- Reduces emotional investing
- Eliminates market timing pressure
- Lowers the impact of volatility
- Builds consistent investment habits
- Suitable for beginners
- Easy to automate
- Encourages long-term thinking
For many investors, DCA removes the stress of constantly checking Bitcoin charts.
How to Dollar Cost Average Into Bitcoin Step by Step
Determine Your Investment Budget
Start by deciding how much money you can comfortably invest.
A good rule is:
- Invest only what you can afford to leave untouched for several years.
- Never invest emergency funds.
- Avoid borrowing money to buy Bitcoin.
Examples:
- $25 weekly
- $50 weekly
- $100 biweekly
- $500 monthly
Consistency matters more than the amount.
Choose Your DCA Frequency
The next step is selecting how often you’ll buy Bitcoin.
Common schedules include:
Daily DCA
Best for:
- Frequent accumulators
- Highly automated investing
Pros:
- Maximum smoothing effect
Cons:
- More transaction fees on some platforms
Weekly DCA
Best for:
- Most investors
- Salary earners
Pros:
- Balanced approach
- Easy to manage
Monthly DCA
Best for:
- Long-term investors
- Larger purchases
Pros:
- Fewer transactions
Cons:
- Slightly less averaging effect
Lump Sum vs Dollar Cost Averaging Into Bitcoin
One of the biggest debates in investing is whether to invest all at once or gradually.
| Factor | Lump Sum | DCA |
|---|---|---|
| Market Timing Required | High | Low |
| Emotional Stress | High | Low |
| Risk Exposure | Immediate | Gradual |
| Volatility Impact | High | Reduced |
| Beginner Friendly | No | Yes |
Historically, lump-sum investing can outperform during strong bull markets because money enters the market earlier.
However, DCA often wins from a behavioral perspective because investors are more likely to stick with their strategy.
Example of a Bitcoin DCA Strategy
Imagine Sarah wants to invest $6,000 into Bitcoin.
Instead of buying all at once, she invests:
- $500 every month
- For 12 months
Benefits:
- Lower emotional stress
- Reduced regret from buying near a local peak
- Consistent exposure to Bitcoin
This strategy allows Sarah to focus on accumulation rather than short-term price predictions.
Best Time to Start DCA Into Bitcoin
A common question is:
Should I Wait for a Market Crash?
Many investors spend months waiting for the “perfect entry.”
Unfortunately, nobody knows where the next bottom will occur.
A popular saying among investors is:
Time in the market beats timing the market.
If you believe Bitcoin has long-term potential, starting a disciplined DCA plan today often makes more sense than endlessly waiting.
Advanced Bitcoin DCA Strategies
Experienced investors sometimes enhance traditional DCA methods.
Value Averaging
Instead of investing a fixed amount, you adjust contributions based on portfolio performance.
Example:
- Bitcoin drops significantly → invest more.
- Bitcoin rises sharply → invest less.
This approach requires more monitoring.
Dynamic DCA
Dynamic DCA adjusts purchases according to market conditions.
For example:
- Buy 2x more during major corrections.
- Buy normal amounts during neutral markets.
- Reduce purchases during extreme euphoria.
Many investors use indicators such as:
- Bitcoin Fear and Greed Index
- MVRV Ratio
- Bitcoin Drawdown Levels
- On-Chain Metrics
Hybrid Strategy
Some investors combine:
- 80% regular DCA
- 20% opportunistic buying during market crashes
This maintains consistency while taking advantage of large discounts.
Common Mistakes to Avoid When DCAing Into Bitcoin
Investing Money You Need Soon
Bitcoin remains a volatile asset.
Avoid investing money needed for:
- Rent
- Bills
- Emergency expenses
- Short-term goals
Stopping During Bear Markets
Many investors quit when prices fall.
Ironically, bear markets often provide the most attractive accumulation opportunities.
Checking Prices Constantly
Daily price watching can lead to emotional decisions.
Remember:
The goal of DCA is consistency.
Ignoring Fees
Small fees can add up over hundreds of purchases.
Always compare:
- Trading fees
- Deposit fees
- Withdrawal fees
Failing to Secure Your Bitcoin
Security should grow with your portfolio.
As your holdings increase, consider stronger self-custody solutions.
Does Bitcoin DCA Actually Work?
Historical data suggests that long-term Bitcoin investors who consistently accumulated through multiple market cycles often achieved favorable results compared to those attempting to perfectly time entries.
Why?
Because DCA:
- Reduces emotional mistakes
- Encourages disciplined investing
- Keeps investors active during bear markets
- Benefits from long-term Bitcoin adoption trends
No strategy guarantees profits, but DCA remains one of the most widely recommended approaches for Bitcoin accumulation.
Who Should Use Dollar Cost Averaging?
DCA is ideal for:
- Beginners
- Busy professionals
- Long-term investors
- Retirement-focused investors
- People uncomfortable with market timing
It may be less suitable for investors with large lump sums and extensive market experience.
Related Bitcoin Investing Terms You Should Know
Understanding these concepts can improve your DCA strategy:
- Bitcoin accumulation
- Long-term Bitcoin investing
- Bitcoin portfolio management
- Bitcoin risk management
- Bitcoin market cycles
- Crypto investment strategy
- Bitcoin halving
- Bitcoin volatility
- On-chain analysis
- Bitcoin self-custody
- Bitcoin recurring purchases
- Crypto wealth building
- Passive Bitcoin investing
- Bitcoin bear markets
- Bitcoin bull markets
- Portfolio diversification
- Digital asset investing
- Bitcoin adoption
- Crypto dollar cost averaging
- Bitcoin investment plan
Frequently Asked Questions
Is dollar cost averaging into Bitcoin a good strategy?
Yes. DCA helps reduce volatility risk, removes emotional decision-making, and encourages consistent long-term investing.
How much should I DCA into Bitcoin each month?
Invest an amount that fits your financial situation. Consistency matters more than the size of each purchase.
Is weekly or monthly Bitcoin DCA better?
Weekly DCA often provides better price averaging, while monthly DCA is simpler and involves fewer transactions.
Can I automate Bitcoin DCA?
Yes. Most major cryptocurrency exchanges offer recurring Bitcoin purchase features.
Does DCA guarantee profits?
No. DCA reduces timing risk but cannot eliminate market risk or guarantee returns.
Should I stop DCA during a Bitcoin bear market?
Many long-term investors continue DCA during bear markets because lower prices allow them to accumulate more Bitcoin.
What is the biggest advantage of Bitcoin DCA?
The biggest advantage is removing the need to predict market movements while building a position over time.
Conclusion
Learning how to dollar cost average into Bitcoin is one of the smartest steps a new investor can take. Rather than stressing over market timing, DCA provides a disciplined framework for steadily building Bitcoin exposure over the long term.
Whether you invest weekly, biweekly, or monthly, the key is consistency. By sticking to a well-defined plan, managing risk, and focusing on long-term goals, you can navigate Bitcoin’s volatility with greater confidence.
At The Crypto Investors, we help investors understand Bitcoin, on-chain metrics, market cycles, and proven crypto investing strategies. Explore more expert guides to strengthen your knowledge and make smarter cryptocurrency investment decisions.

Bitcoin Stock to Flow Model: Complete Guide for Investors
Bitcoin Stock to Flow Model: Complete Guide to Bitcoin Scarcity and Price Prediction
The bitcoin stock to flow model is a valuation framework that measures Bitcoin’s scarcity by comparing its existing supply (stock) to newly created coins (flow). Developed by PlanB, the model suggests that Bitcoin’s price tends to increase as scarcity rises after each halving event. While widely used by investors, it should be combined with other indicators because market conditions, demand, and macroeconomic factors also influence Bitcoin’s price.
Introduction
The bitcoin stock to flow model has become one of the most discussed valuation methods in the cryptocurrency industry. Since Bitcoin is designed with a fixed supply of 21 million coins, many investors use scarcity-based models to estimate its long-term value. Among these approaches, the Stock-to-Flow (S2F) model gained significant attention for attempting to predict Bitcoin’s future price based on its scarcity.
But how does the model work? Is it reliable? And should investors use it when making Bitcoin investment decisions?
In this comprehensive guide, you’ll learn everything about the Bitcoin Stock-to-Flow model, including its formula, history, advantages, criticisms, and practical applications.
What Is the Bitcoin Stock to Flow Model?
The Bitcoin Stock-to-Flow Model is a scarcity-based valuation framework created by cryptocurrency analyst PlanB in 2019.
The model compares:
• Existing Bitcoin supply (Stock)
• Newly mined Bitcoin each year (Flow)
The core idea is simple:
Assets with greater scarcity tend to hold higher value over time.
Since Bitcoin has a limited supply and periodic halving events reduce new coin issuance, its scarcity increases over time. The model suggests this increasing scarcity should lead to higher prices.
Stock vs Flow Explained
Term Meaning
Stock Total Bitcoin current circulation
Flow New Bitcoin mined annually
Stock-to-Flow Ratio Stock ÷ Annual Flow
A higher ratio indicates greater scarcity.
Why Scarcity Matters in Bitcoin
Scarcity has historically played a significant role in determining the value of assets.
Examples include:
• Gold
• Silver
• Precious metals
• Rare collectibles
• Limited-edition assets
Bitcoin shares several characteristics with these assets:
• Fixed supply cap
• Predictable issuance schedule
• Transparent monetary policy
• Increasing scarcity over time
Unlike fiat currencies that can be printed by central banks, Bitcoin’s supply is mathematically controlled.
This feature makes Bitcoin attractive to investors seeking protection against inflation and currency debasement.
How the Bitcoin Stock to Flow Model Works
The Stock-to-Flow ratio is calculated using a straightforward formula.
Stock-to-Flow Formula
S2F Ratio = Total Existing Supply ÷ Annual New Supply
For example:
Suppose:
• Existing Bitcoin supply = 19.8 million BTC
• New Bitcoins mined annually = 164,250 BTC
Calculation:
19,800,000 ÷ 164,250 = 120.5
This means Bitcoin would require approximately 120 years of production at current issuance rates to recreate the existing supply.
The higher the ratio, the scarcer Bitcoin becomes.
The History Behind PlanB’s Stock-to-Flow Model
PlanB published the original Bitcoin Stock-to-Flow paper in March 2019.
The model gained popularity because:
• It matched Bitcoin’s historical price data remarkably well.
• It linked scarcity directly to valuation.
• It provided long-term price projections.
The original model suggested Bitcoin could eventually reach six-figure valuations following successive halving cycles.
Many investors, analysts, and institutions began referencing the model during the 2020-2021 bull market.
Benefits of the Bitcoin Stock to Flow Model
Easy to Understand
The model simplifies Bitcoin valuation by focusing on scarcity.
Highlights Bitcoin’s Fixed Supply
It emphasizes one of Bitcoin’s strongest economic characteristics.
Long-Term Perspective
The model encourages investors to think beyond short-term market volatility.
Historical Correlation
For several years, Bitcoin’s price movements loosely followed the model’s projected trajectory.
Useful for Macro Analysis
Investors often use S2F alongside:
• On-chain analysis
• Bitcoin MVRV ratio
• Bitcoin cycle indicators
• Market sentiment metrics
• Macroeconomic trends
Limitations of the Stock-to-Flow Model
Despite its popularity, the model has several weaknesses.
Demand Is Ignored
Scarcity alone doesn’t determine value.
Price depends on:
• Buyer demand
• Institutional adoption
• Regulatory developments
• Global economic conditions
Historical Correlation Doesn’t Guarantee Future Results
Past performance cannot predict future outcomes with certainty.
Market Maturity Changes Dynamics
As Bitcoin matures:
• Volatility decreases
• Institutional participation increases
• Market efficiency improves
These factors can alter historical patterns.
How Investors Use the Bitcoin Stock to Flow Model
Many long-term investors use S2F as part of a broader strategy.
Common Uses
- Evaluating Bitcoin scarcity
2. Understanding halving cycles
3. Assessing long-term valuation potential
4. Supporting dollar-cost averaging strategies
5. Comparing Bitcoin with gold and other scarce assets
Successful investors combine:
• Fundamental analysis
• Technical analysis
• On-chain metrics
• Risk management
Real-World Example
Imagine two assets:
Asset A
• Existing supply: 100 million units
• Annual production: 20 million units
S2F Ratio = 5
Asset B
• Existing supply: 100 million units
• Annual production: 1 million units
S2F Ratio = 100
Asset B is significantly scarcer.
According to Stock-to-Flow theory, Asset B should command a higher value due to its limited future supply.
Bitcoin increasingly resembles Asset B after each halving event.
Criticisms from Economists and Analysts
Several economists challenge the model.
Common criticisms include:
• Correlation is not causation.
• Scarcity alone cannot determine price.
• Market demand fluctuates.
• Regulatory risks affect valuation.
• Macroeconomic events can overpower scarcity effects.
The model should therefore be viewed as a framework rather than a precise forecasting tool.
Related Bitcoin Metrics Worth Tracking
Beyond Stock-to-Flow, consider monitoring:
• Bitcoin MVRV Ratio
• Realized Cap
• Hash RateActive Addresses
• Exchange Reserves
• Bitcoin Dominance
• Fear and Greed Index
• Long-Term Holder Supply
• Miner Revenue
• SOPR Indicator
Together, these metrics provide a more complete view of Bitcoin’s market health.
Frequently Asked Questions
What is the Bitcoin Stock to Flow Model?
The Bitcoin Stock-to-Flow Model is a valuation framework that measures Bitcoin’s scarcity by comparing existing supply to annual new supply.
Who created the Bitcoin Stock to Flow Model?
The model was created by cryptocurrency analyst PlanB and published in 2019.
How is the Stock-to-Flow ratio calculated?
It is calculated by dividing Bitcoin’s current circulating supply by the number of new Bitcoins mined annually.
Why does Bitcoin halving affect the Stock-to-Flow ratio?
Halving reduces the rate of new Bitcoin issuance, increasing scarcity and raising the Stock-to-Flow ratio.
Is the Stock-to-Flow Model accurate?
The model showed historical correlation with Bitcoin’s price but has experienced notable deviations in recent market cycles.
Can the Stock-to-Flow Model predict Bitcoin’s future price?
It provides a framework for understanding scarcity but should not be considered a guaranteed forecasting tool.
Should investors rely only on Stock-to-Flow?
No. Investors should combine it with technical analysis, on-chain metrics, market sentiment, and risk management strategies.
Conclusion
The bitcoin stock to flow model remains one of the most influential frameworks for understanding Bitcoin’s scarcity and long-term value proposition. By comparing existing supply with newly issued coins, the model highlights why many investors view Bitcoin as a scarce digital asset similar to gold.
However, no valuation model is perfect. While Stock-to-Flow offers valuable insights into Bitcoin’s supply dynamics, investors should also consider demand, adoption trends, macroeconomic conditions, and on-chain data before making investment decisions.
For more expert Bitcoin analysis, crypto investing guides, market insights, and educational resources, visit The Crypto Investors and stay ahead of the rapidly evolving cryptocurrency market.

Bitcoin MVRV Ratio Explained: A Complete Guide for Smarter Bitcoin Investing
The Bitcoin MVRV Ratio compares Bitcoin’s market value to its realized value to determine whether BTC is overvalued or undervalued. Investors use this on-chain metric to identify potential market tops, bottoms, and long-term buying opportunities. A high MVRV often signals overheating, while a low MVRV may indicate undervaluation and attractive accumulation zones.
Bitcoin MVRV Ratio Explained: A Complete Guide for Smarter Bitcoin Investing
Introduction
If you’ve spent any time analyzing Bitcoin beyond price charts, you’ve probably encountered the term bitcoin MVRV ratio explained in discussions about market cycles and on-chain analysis. The MVRV Ratio is one of the most respected Bitcoin indicators because it helps investors understand whether BTC is trading above or below its fair value.
In this guide, you’ll learn what the Bitcoin MVRV Ratio is, how it works, how to interpret it, and how experienced investors use it to make better decisions.
What Is the Bitcoin MVRV Ratio?
The Bitcoin MVRV Ratio stands for:
MVRV = Market Value to Realized Value
It compares Bitcoin’s current market capitalization with its realized capitalization.
Formula:
Metric Meaning
Market Value (MV) Current Bitcoin market capitalization
Realized Value (RV) Value of all BTC based on the price when coins last moved
MVRV Ratio Market Value ÷ Realized Value
The ratio helps determine whether Bitcoin is currently overvalued, fairly valued, or undervalued relative to historical investor cost basis.
Understanding Market Value
Market Value is straight forward.
Formula:
Market Cap = Current BTC Price × Circulating Supply
For example:
Bitcoin price = $100,000
Circulating supply = 19.8 million BTC
Market Value:
$100,000 × 19.8 million = $1.98 trillion
This represents the total market valuation of Bitcoin at current prices.
Understanding Realized Value
Realized Value is where MVRV becomes powerful.
Instead of valuing every Bitcoin at today’s price, Realized Cap values each coin at the price when it was last moved on-chain.
For example:
BTC Amount Last Moved Price
1 BTC $10,000
2 BTC $20,000
3 BTC $50,000
The realized capitalization is calculated using those historical movement prices rather than the current market price.
This creates a more realistic estimate of the average investor cost basis.
Why the Bitcoin MVRV Ratio Matters
Most market participants focus only on price.
The MVRV Ratio reveals something much more important:
- Investor profitability
- Market sentiment
- Overvaluation levels
- Undervaluation opportunities
- Potential cycle turning points
Because it reflects the average unrealized profit or loss across the network, it often provides early warnings before major market reversals.
How to Interpret the MVRV Ratio
MVRV Above 3.5
Historically, values above 3.5 have often occurred near Bitcoin bull market tops.
This suggests:
- Investors are sitting on large profits
- Market optimism is extremely high
- Selling pressure may increase
Past cycle peaks frequently formed when MVRV entered this zone.
MVRV Between 1 and 3.5
This is generally considered a healthy market range.
Characteristics include:
- Sustainable price growth
- Normal investor profitability
Most bull market expansions occur within this range.
MVRV Near 1
An MVRV around 1 means:
- Market value equals realized value
- Average investor is near break-even
- Fair valuation conditions exist
Historically, this area has often served as support during market corrections.
MVRV Below 1
This is one of the most closely watched signals.
It indicates:
- Average holders are in unrealized losses
- Fear dominates sentiment
- Bitcoin may be undervalued
Many long-term investors view MVRV below 1 as a potential accumulation zone.
Historical Bitcoin MVRV Examples
2011 Bull Market
MVRV surged above extreme levels as speculative enthusiasm pushed Bitcoin prices dramatically higher.
A major correction followed shortly afterward.
2013 Cycle Peak
The indicator again entered historically overheated territory before Bitcoin experienced a severe bear market.
2017 Bull Run
When Bitcoin approached $20,000, MVRV signaled substantial overvaluation.
The subsequent bear market validated the warning.
2021 Market Top
MVRV reached elevated levels during Bitcoin’s run toward all-time highs.
Although exact timing is never guaranteed, the metric successfully highlighted excessive profitability across the network.
MVRV Z-Score Explained
Many analysts also track the MVRV Z-Score.
This enhanced version compares:
- Market Value
- Realized Value
- Historical volatility
Benefits include:
- Better cycle-top identification
- Stronger bear market signals
- Improved long-term valuation analysis
The MVRV Z-Score has become one of the most widely followed on-chain metrics among professional crypto analysts.
How Long-Term Investors Use MVRV
Experienced Bitcoin investors rarely rely on a single indicator.
Instead, they combine MVRV with:
- Bitcoin halving cycles
- Realized price
- Puell Multiple
- Net Unrealized Profit/Loss (NUPL)
- Exchange reserves
- Long-term holder data
A common strategy looks like this:
Accumulation Phase
When:
- MVRV falls below 1
- Fear is widespread
- Long-term conviction remains strong
Investors gradually accumulate Bitcoin.
Distribution Phase
When:
- MVRV exceeds historical extremes
- Market euphoria increases
- Media coverage becomes excessive
Investors may begin taking partial profits.
Advantages of Using the Bitcoin MVRV Ratio
Data-Based Insights
MVRV relies on blockchain data rather than speculation.
Historical Reliability
The metric has successfully identified multiple market extremes.
Long-Term Focus
It helps investors avoid emotional decisions.
Market Cycle Understanding
MVRV provides context that simple price charts often miss.
Limitations of the MVRV Ratio
No indicator is perfect.
Not a Timing Tool
MVRV can remain elevated for months before a market top forms.
Market Structure Evolves
Institutional adoption may affect historical patterns.
Requires Context
MVRV works best alongside other on-chain metrics.
False Expectations
High MVRV does not guarantee an immediate correction.
Investors should use it as part of a broader strategy rather than a standalone signal.
Common Mistakes When Using MVRV
Assuming Every High Reading Means Sell
Markets can remain overvalued longer than expected.
Ignoring Macro Conditions
Interest rates, liquidity, and economic trends still matter.
Using MVRV for Day Trading
The indicator was designed for cycle analysis, not short-term trading.
Ignoring Other On-Chain Signals
Combining metrics typically produces better results.
Related Bitcoin Metrics Worth Tracking
To improve your market analysis, monitor:
- Bitcoin Realized Price
- MVRV Z-Score
- Puell Multiple
- NUPL Indicator
- Hash Ribbons
- Stock-to-Flow Model
- Exchange Net Flows
- Long-Term Holder Supply
- Miner Reserves
- Bitcoin Dominance
Together, these metrics provide a more complete picture of market conditions.
How Beginners Can Use MVRV Effectively
If you’re new to Bitcoin investing:
Learn the basics of on-chain analysis.
Track MVRV weekly rather than daily.
Focus on long-term trends.
Combine MVRV with risk management.
Avoid emotional decisions based solely on price movements.
Study previous Bitcoin cycles.
Maintain a long-term investment perspective.
This approach can help reduce impulsive decisions during periods of extreme fear or greed.
Frequently Asked Questions
What is the Bitcoin MVRV Ratio?
The Bitcoin MVRV Ratio compares Bitcoin’s market capitalization with its realized capitalization to determine whether BTC is overvalued or undervalued.
What does an MVRV Ratio above 3 mean?
A reading above 3 generally indicates strong investor profits and potentially overheated market conditions.
Is MVRV a buy signal?
Not directly. However, historically low MVRV values have often coincided with attractive long-term accumulation opportunities.
What does MVRV below 1 mean?
It means the average Bitcoin holder is in an unrealized loss position, which has historically occurred near bear market bottoms.
What is the difference between MVRV and MVRV Z-Score?
The MVRV Z-Score incorporates historical volatility, providing additional context for identifying extreme market conditions.
Can MVRV predict Bitcoin tops?
It cannot predict exact tops, but it has historically highlighted periods of significant overvaluation before major corrections.
Should I use MVRV alone?
No. Combining MVRV with other on-chain indicators and market analysis techniques generally leads to better investment decisions.
Conclusion
Understanding the bitcoin MVRV ratio explained is essential for anyone serious about Bitcoin investing and on-chain analysis. By comparing market value to realized value, MVRV offers unique insight into investor profitability, market sentiment, and potential cycle turning points.
While no indicator can perfectly predict future price movements, MVRV remains one of the most trusted tools for identifying periods of extreme fear and excessive optimism. Used alongside other on-chain metrics and sound risk management, it can help investors make more informed decisions throughout Bitcoin’s market cycles.
For more in-depth Bitcoin analysis, crypto market insights, and professional investment education, visit thecryptoinvestors.com� and stay ahead of the next market cycle with data-driven strategies.
Bitcoin Fear and Greed Index Explained: A Complete Guide for Crypto Investors
Bitcoin Fear and Greed Index Explained: A Complete Guide for Crypto Investors
The Bitcoin Fear and Greed Index is a market sentiment indicator that measures whether crypto investors are fearful or greedy. It combines volatility, momentum, social trends, market dominance, and other data points into a score from 0 to 100. Many traders use it to identify potential buying opportunities during extreme fear and possible profit-taking periods during extreme greed.
Introduction
The crypto market is heavily driven by psychology. When prices rise rapidly, investors often become greedy and chase gains. When prices crash, fear takes over and many people sell at a loss. The Bitcoin Fear and Greed Index was created to measure these emotions and provide insight into the overall mood of the market.
What Is the Bitcoin Fear and Greed Index?
The Bitcoin Fear and Greed Index is a sentiment analysis tool that measures investor emotions in the cryptocurrency market.
The index assigns a score between 0 and 100:
| Score Range | Sentiment |
|---|---|
| 0-24 | Extreme Fear |
| 25-49 | Fear |
| 50 | Neutral |
| 51-74 | Greed |
| 75-100 | Extreme Greed |
The concept is based on a famous investing principle:
Be fearful when others are greedy, and greedy when others are fearful.
When investors become excessively fearful, Bitcoin may be undervalued. When investors become extremely greedy, Bitcoin could be overvalued or approaching a market correction.
Why Market Sentiment Matters in Bitcoin Investing
Unlike traditional assets, Bitcoin is highly influenced by investor emotions.
Several factors contribute to this:
- High volatility
- Speculative trading
- Global news events
- Social media influence
- Institutional adoption announcements
- Regulatory developments
As a result, sentiment often drives short-term price movements more than fundamentals.
Understanding market sentiment helps investors:
- Avoid panic selling
- Prevent FOMO buying
- Identify potential trend reversals
- Improve risk management
- Make more rational decisions
How the Bitcoin Fear and Greed Index Is Calculated
The index combines multiple data sources to create a single sentiment score.
Market Volatility
Bitcoin’s recent volatility is compared to historical averages.
Higher-than-normal volatility often signals fear because investors are uncertain about market direction.
Market Momentum and Trading Volume
Strong buying pressure and increasing volume generally indicate growing greed.
When traders aggressively buy Bitcoin, sentiment tends to become more optimistic.
Social Media Activity
Cryptocurrency discussions on social platforms are monitored.
An increase in positive Bitcoin conversations often contributes to higher greed scores.
Bitcoin Dominance
Bitcoin dominance refers to Bitcoin’s share of the total cryptocurrency market capitalization.
Rising dominance can sometimes indicate fear as investors move funds from riskier altcoins into Bitcoin.
Search Trends
Search engine activity provides valuable insights into investor interest.
Examples include:
- Bitcoin price prediction
- Should I buy Bitcoin now
- Bitcoin crash
- Bitcoin all-time high
Search behavior often reflects broader market sentiment.
Understanding Extreme Fear
Extreme fear occurs when the index falls below 25.
This typically happens during:
- Major market crashes
- Regulatory uncertainty
- Economic instability
- Negative crypto news
- Large liquidation events
What Extreme Fear Can Signal
Historically, extreme fear has often appeared near market bottoms.
This doesn’t guarantee prices will immediately rise, but it suggests investors may be overreacting.
Examples include:
- Bear market capitulation phases
- Significant Bitcoin corrections
- Panic-selling events
Many long-term investors view extreme fear as an opportunity to accumulate Bitcoin gradually.
Understanding Extreme Greed
Extreme greed occurs when the index exceeds 75.
This often coincides with:
- Rapid price rallies
- Bull market euphoria
- Media hype
- Increased retail participation
- Record-breaking Bitcoin prices
Risks of Extreme Greed
When greed becomes excessive:
- Investors ignore risks
- FOMO increases
- Market speculation accelerates
- Corrections become more likely
Extreme greed doesn’t automatically mean prices will crash, but it may indicate heightened risk.
How Successful Investors Use the Fear and Greed Index
Professional investors rarely rely on a single indicator.
Instead, they use the Fear and Greed Index alongside:
- Technical analysis
- On-chain metrics
- Bitcoin dominance
- Trading volume
- Macroeconomic trends
- Support and resistance levels
Contrarian Investing Strategy
Contrarian investors often do the opposite of the crowd.
Basic approach:
- Monitor sentiment levels.
- Look for extreme fear conditions.
- Conduct additional market analysis.
- Consider gradual accumulation.
- Reduce risk during extreme greed periods.
This strategy focuses on controlling emotions rather than predicting exact market tops and bottoms.
Common Mistakes Investors Make
Treating the Index as a Buy Signal
A low score does not guarantee a market bottom.
Prices can continue falling even when fear is extreme.
Ignoring Broader Market Conditions
Macroeconomic events still matter.
Interest rates, inflation, liquidity conditions, and regulations can significantly impact Bitcoin prices.
Following Sentiment Blindly
The index should support decision-making, not replace analysis.
Always combine sentiment data with:
- Risk assessment
- Portfolio management
- Technical indicators
- Fundamental research
Overreacting to Daily Changes
The index can fluctuate quickly.
Long-term investors should focus on broader trends rather than daily sentiment shifts.
Fear and Greed Index vs Technical Analysis
Many investors wonder whether sentiment analysis is better than technical analysis.
The answer is that both serve different purposes.
| Fear and Greed Index | Technical Analysis |
|---|---|
| Measures emotion | Measures price action |
| Identifies sentiment extremes | Identifies chart patterns |
| Useful for market psychology | Useful for entry and exit timing |
| Helps spot crowd behavior | Helps spot trends |
The strongest strategies often combine both approaches.
Best Practices for Using the Bitcoin Fear and Greed Index
To get the most value from this indicator:
- Use it as a sentiment tool, not a prediction tool.
- Monitor long-term trends.
- Combine it with technical analysis.
- Review on-chain Bitcoin metrics.
- Follow risk management rules.
- Maintain a long-term investment perspective.
- Avoid emotional decisions.
A Simple Framework
When Fear Is High:
- Review market fundamentals.
- Look for quality buying opportunities.
- Avoid panic selling.
When Greed Is High:
- Reassess portfolio risk.
- Consider profit-taking plans.
- Avoid chasing momentum blindly.
Related Metrics Worth Monitoring
The Fear and Greed Index becomes more powerful when paired with additional crypto indicators.
Useful metrics include:
- Bitcoin market sentiment
- Crypto market psychology
- Bitcoin volatility index
- On-chain analysis
- Bitcoin dominance chart
- Trading volume analysis
- Relative Strength Index (RSI)
- Market cycle indicators
- Crypto investor sentiment
- Bitcoin accumulation trends
- Long-term holder activity
- Bull market indicators
- Bear market indicators
- Crypto risk management metrics
- Bitcoin price prediction models
Can Beginners Use the Fear and Greed Index?
Absolutely.
The index is one of the easiest cryptocurrency indicators to understand.
Beginners can use it to:
- Learn market psychology
- Recognize emotional trading behavior
- Improve investment discipline
- Build long-term strategies
- Avoid common crypto investing mistakes
However, it should never be the sole basis for investment decisions.
Frequently Asked Questions
What is the Bitcoin Fear and Greed Index?
The Bitcoin Fear and Greed Index is a sentiment indicator that measures investor emotions in the cryptocurrency market on a scale from 0 to 100.
Is the Fear and Greed Index accurate?
It provides valuable insight into market sentiment but should be used alongside technical, fundamental, and on-chain analysis.
What does extreme fear mean in Bitcoin?
Extreme fear indicates that investors are highly pessimistic. Historically, it has often appeared during market downturns and potential accumulation phases.
What does extreme greed mean in Bitcoin?
Extreme greed suggests investors are overly optimistic, which can sometimes precede market corrections or increased volatility.
Can I trade Bitcoin using only the Fear and Greed Index?
No. The index should be part of a broader strategy that includes risk management, technical analysis, and market research.
How often does the Fear and Greed Index update?
Most versions of the index update daily to reflect changing market conditions and investor sentiment.
Is the Fear and Greed Index useful for long-term investors?
Yes. Long-term investors often use it to identify periods of excessive fear or greed and make more disciplined investment decisions.
Conclusion
Understanding the bitcoin fear and greed index explained concept can significantly improve your ability to navigate the cryptocurrency market. Rather than reacting emotionally to headlines, price swings, or social media hype, the index helps you understand how the broader market is feeling at any given moment.
While no indicator can perfectly predict Bitcoin’s future price movements, the Fear and Greed Index offers valuable insight into market psychology and investor behavior. When combined with technical analysis, on-chain data, and sound risk management, it can become a powerful part of your crypto investing toolkit.
For more expert Bitcoin investment insights, crypto market analysis, portfolio strategies, and educational resources, visit The Crypto Investors and stay ahead of the rapidly evolving cryptocurrency market.

What Is Bitcoin Halving and Why It Matters: A Complete Guide for Investors
What Is Bitcoin Halving and Why It Matters: A Complete Guide for Investors
Bitcoin halving is a pre-programmed event that reduces the reward miners receive for validating transactions by 50%. It occurs approximately every four years and slows the creation of new bitcoins. This mechanism helps maintain Bitcoin’s scarcity, influences mining economics, and has historically been associated with major market cycles, making it an important event for investors and the broader cryptocurrency ecosystem.
What Is Bitcoin Halving?
Bitcoin halving is a scheduled event in the Bitcoin network that reduces the number of new bitcoins awarded to miners by 50%.
Miners validate transactions and secure the Bitcoin blockchain. In return for their work, they receive newly created bitcoins as block rewards. However, Bitcoin’s anonymous creator, Satoshi Nakamoto, designed the protocol so these rewards decrease over time.
This reduction happens after every 210,000 blocks, which takes approximately four years.
Here’s how the block reward has changed over the years:
| Bitcoin Halving Event | Year | Block Reward Before | Block Reward After |
|---|---|---|---|
| First Halving | 2012 | 50 BTC | 25 BTC |
| Second Halving | 2016 | 25 BTC | 12.5 BTC |
| Third Halving | 2020 | 12.5 BTC | 6.25 BTC |
| Fourth Halving | 2024 | 6.25 BTC | 3.125 BTC |
Eventually, Bitcoin’s maximum supply will reach 21 million coins, making it one of the scarcest digital assets in existence.
How Does Bitcoin Halving Work?
To understand why Bitcoin halving matters, it’s important to understand Bitcoin mining.
Mining involves solving complex mathematical problems using specialized computers. When miners successfully validate a block of transactions, they receive a reward in Bitcoin.
The halving mechanism automatically reduces these rewards according to Bitcoin’s code.
For example:
- Before 2024, miners earned 6.25 BTC per block.
- After the 2024 halving, miners began earning 3.125 BTC per block.
- The next halving will reduce rewards even further.
No government, company, or individual controls this process. The rules are embedded directly into the Bitcoin protocol.
Bitcoin Halving and Digital Scarcity
Scarcity plays a significant role in determining value.
Precious metals such as gold derive part of their value from limited availability. Similarly, Bitcoin’s capped supply contributes to its appeal as a store of value.
Each halving reduces the rate at which new bitcoins enter circulation.
Consider the following:
- Fewer new bitcoins become available for purchase.
- Existing holders may choose to retain their assets.
- Demand can increase while supply growth decreases.
Although scarcity alone does not guarantee higher prices, it remains a crucial factor in Bitcoin’s economic model.
Historical Impact of Bitcoin Halving on Bitcoin Price
One reason investors closely monitor halvings is the historical relationship between these events and Bitcoin price cycles.
The 2012 Bitcoin Halving
- Reward reduced from 50 BTC to 25 BTC.
- Bitcoin traded near $12 during the halving period.
- Significant price appreciation followed in the subsequent year.
The 2016 Bitcoin Halving
Rewards fell from 25 BTC to 12.5 BTC. Bitcoin traded around $650. The following market cycle saw Bitcoin reach new all-time highs.
The 2020 Bitcoin Halving
- Rewards decreased from 12.5 BTC to 6.25 BTC.
- Bitcoin traded near $8,000–$9,000.
- The years that followed witnessed substantial institutional interest and record-breaking prices.
It’s important to remember that correlation does not guarantee causation. Factors such as macroeconomic conditions, investor sentiment, regulatory developments, and adoption trends also influence Bitcoin prices.
How Bitcoin Halving Affects Miners
Bitcoin miners experience the most immediate impact from halving events.
Because block rewards decrease by 50%, mining profitability can come under pressure.
Miners typically respond in several ways:
- Upgrading to more energy-efficient hardware.
- Reducing operational costs.
- Relocating to regions with cheaper electricity.
- Relying more heavily on transaction fees.
Less efficient mining operations may struggle to remain profitable after a halving.
However, if Bitcoin prices rise over time, mining profitability can improve despite lower rewards.
Bitcoin Halving vs Traditional Monetary Systems
The contrast between Bitcoin and fiat currencies highlights why many investors find Bitcoin appealing.
| Feature | Bitcoin | Traditional Fiat Currency |
|---|---|---|
| Supply Limit | 21 Million BTC | No fixed limit |
| Inflation Control | Algorithm-based | Central bank policies |
| Issuance Schedule | Predictable | Flexible |
| Transparency | Public blockchain | Policy-driven |
| Monetary Authority | Decentralized | Centralized |
Bitcoin’s transparent and predetermined supply schedule offers a level of predictability rarely found in conventional financial systems.
Bitcoin Halving Guarantees Price Increases
No event can guarantee future returns. Historical performance should never be treated as certainty.
Bitcoin Becomes More Valuable Overnight
Market reactions often unfold gradually over months rather than immediately after a halving.
Bitcoin Halving Is a Manual Decision
The process is fully automated and coded into Bitcoin’s protocol.
What Happens After All Bitcoin Halvings Are Complete?
One of the most fascinating aspects of Bitcoin is that its monetary policy has already been defined decades into the future.
Since Bitcoin halving reduces mining rewards by 50% approximately every four years, there will eventually come a point when no new bitcoins are created. Based on the current schedule, the last bitcoin is expected to be mined around the year 2140.
At that stage:
- The total Bitcoin supply will reach 21 million BTC.
- Miners will no longer receive block rewards.
- Transaction fees will become miners’ primary source of income.
- The Bitcoin network will continue operating through decentralized validation.
This design demonstrates Bitcoin’s long-term approach to sustainability and scarcity.
Does Bitcoin Halving Always Lead to a Bull Market?
This is one of the most searched questions related to Bitcoin halving.
Historically, Bitcoin has experienced significant price appreciation in the months following previous halving events. However, investors should avoid assuming that history will repeat itself exactly.
Several factors influence Bitcoin’s price, including:
- Global economic conditions.
- Institutional adoption.
- Government regulations.
- Interest rates and monetary policies.
- Investor sentiment.
- Technological developments within the crypto industry.
The halving reduces the rate of new supply entering the market, but demand remains the determining factor behind long-term price growth.
A balanced approach involves viewing halving as one piece of a broader investment framework rather than a guaranteed profit signal.
Why Bitcoin Halving Matters Beyond Investors
Bitcoin halving doesn’t only affect traders and long-term holders. Its influence extends across the broader digital asset ecosystem.
Impact on Cryptocurrency Markets
Bitcoin often sets the tone for the wider crypto market. Major Bitcoin events can affect market sentiment and liquidity across other cryptocurrencies.
Impact on Public Awareness
Every halving cycle tends to renew public interest in Bitcoin, attracting new users and increasing educational discussions around decentralized finance.
Key Takeaways About Bitcoin Halving
If you’re still wondering what is Bitcoin halving and why it matters, remember these essential points:
- Bitcoin halving occurs approximately every four years.
- Mining rewards are reduced by 50% during each event.
- The mechanism limits Bitcoin’s supply growth.
- Bitcoin’s total supply is capped at 21 million coins.
- Historical halvings have coincided with important market cycles.
- Halving influences miners, investors, and the broader cryptocurrency ecosystem.
- Understanding halving can support more informed investment decisions.
Bitcoin halving isn’t merely a technical adjustment within the network. It represents the foundation of Bitcoin’s monetary policy and its approach to digital scarcity.
Frequently Asked Questions
What is Bitcoin halving in simple terms?
Bitcoin halving is an event that cuts the rewards miners receive for validating transactions by 50%. It occurs roughly every four years to control the supply of new bitcoins entering circulation.
Why does Bitcoin halving matter?
Bitcoin halving matters because it reduces supply growth, reinforces scarcity, impacts mining economics, and often influences investor sentiment surrounding Bitcoin.
How often does Bitcoin halving happen?
Bitcoin halving takes place every 210,000 blocks, which is approximately every four years.
Does Bitcoin’s price always increase after halving?
No. While previous halvings have been followed by significant price increases, past performance does not guarantee future results. Market conditions and demand also play critical roles.
How many Bitcoin halvings are left?
Several halvings remain before Bitcoin reaches its maximum supply of 21 million coins. The final bitcoin is expected to be mined around 2140.
Can Bitcoin halving affect mining profitability?
Yes. Since miners receive fewer bitcoins after each halving, less efficient operations may face profitability challenges unless supported by higher Bitcoin prices or lower operating costs.
Is Bitcoin halving good for investors?
Bitcoin halving can be beneficial from a long-term perspective because it reduces supply growth. However, all investments involve risks, and investors should conduct thorough research before making financial decisions.
Conclusion
Understanding what is Bitcoin halving and why it matters is crucial for anyone interested in Bitcoin, whether you’re a curious beginner, a long-term investor, or someone exploring the future of digital assets.
Bitcoin halving is much more than a scheduled reduction in mining rewards. It is the mechanism that preserves Bitcoin’s scarcity, supports its predictable monetary policy, and differentiates it from traditional currencies with unlimited supply potential.
Although halvings have historically aligned with important periods in Bitcoin’s market evolution, they should never be viewed as guaranteed indicators of future price performance. Successful investing requires education, patience, risk management, and a long-term mindset.
At TheCryptoInvestors.com, we are committed to helping readers navigate the rapidly evolving world of cryptocurrency through research-driven insights, practical investment knowledge, and easy-to-understand educational content. If you’re looking to deepen your understanding of Bitcoin, improve your crypto investment strategy, or stay informed about major market developments, explore more expert resources available on our website.
The more you understand Bitcoin’s fundamentals today, the better prepared you’ll be to make confident decisions in tomorrow’s digital economy.

Bitcoin Education for Investors: A Complete Guide to Smarter Investing
Bitcoin Education for Investors: Bitcoin education for investors is essential for understanding how Bitcoin works, managing risks, evaluating market trends, and making informed investment decisions. A strong educational foundation helps investors avoid common mistakes, develop long-term strategies, and navigate the rapidly evolving cryptocurrency market with confidence.
Bitcoin Education for Investors: Introduction
Bitcoin has transformed from an experimental digital currency into one of the world’s most discussed investment assets. Over the past decade, millions of investors have entered the cryptocurrency market seeking growth opportunities, portfolio diversification, and exposure to financial innovation.
However, investing in Bitcoin without proper knowledge can be risky. Market volatility, security concerns, emotional decision-making, and misinformation often lead investors to costly mistakes. This is why bitcoin education for investors has become more important than ever.
Whether you’re a beginner exploring cryptocurrency for the first time or an experienced investor looking to refine your strategy, understanding Bitcoin’s fundamentals can significantly improve your investment decisions.
This guide covers everything investors need to know about Bitcoin, including how it works, investment strategies, risk management techniques, market analysis, and best practices for long-term success.
Why Bitcoin Education Matters for Investors
Many investors enter the cryptocurrency market after hearing success stories or seeing rapid price increases. Unfortunately, investing based on hype rarely leads to sustainable results.
Bitcoin education helps investors:
- Understand how Bitcoin works
- Evaluate investment opportunities objectively
- Reduce emotional decision-making
- Manage risks effectively
- Protect digital assets securely
- Develop long-term investment strategies
- Identify market trends and cycles
Knowledge creates confidence. Investors who understand Bitcoin are often better equipped to handle market fluctuations and make rational decisions during periods of uncertainty.
Understanding Bitcoin Fundamentals
Before investing, it’s important to understand what Bitcoin actually is.
What Is Bitcoin?
Bitcoin is a decentralized digital currency that operates without a central authority such as a government or bank. It was introduced in 2009 by an anonymous creator known as Satoshi Nakamoto.
Unlike traditional currencies, Bitcoin exists entirely online and uses blockchain technology to record transactions securely and transparently.
What Is Blockchain Technology?
Blockchain is a distributed ledger that stores transaction data across thousands of computers worldwide.
Key benefits include:
- Transparency
- Security
- Immutability
- Decentralization
- Global accessibility
Every Bitcoin transaction is verified by the network and permanently recorded on the blockchain.
Why Bitcoin Has Value
Bitcoin’s value comes from several factors:
- Limited supply of 21 million coins
- Growing adoption worldwide
- Decentralized structure
- Strong security network
- Increasing institutional interest
These characteristics make Bitcoin unique compared to traditional financial assets.
Essential Bitcoin Investment Concepts Every Investor Should Know
Successful investing begins with understanding key concepts.
Market Capitalization
Market capitalization represents the total value of all Bitcoin in circulation.
It is calculated by multiplying:
Bitcoin Price × Circulating Supply
Market cap helps investors compare Bitcoin with other cryptocurrencies and traditional assets.
Volatility
Bitcoin is known for price volatility.
Prices can move significantly within hours or days. Investors should understand that volatility is normal and avoid making emotional decisions based on short-term movements.
Liquidity
Liquidity refers to how easily Bitcoin can be bought or sold without significantly affecting its price.
Bitcoin is generally considered one of the most liquid cryptocurrency assets.
How New Investors Can Start Learning Bitcoin
Learning Bitcoin doesn’t happen overnight. The best approach is gradual education.
Study Bitcoin Fundamentals
Begin by understanding:
- Blockchain technology
- Bitcoin mining
- Supply and demand
- Wallets and storage
- Network security
Follow Reliable Educational Sources
Quality information is essential.
Investors should follow:
- Industry reports
- Educational blogs
- Research platforms
- Reputable cryptocurrency news websites
- Professional analysts
Learn Basic Technical Analysis
Technical analysis helps investors understand price movements and market trends.
Key concepts include:
- Support levels
- Resistance levels
- Trend lines
- Volume indicators
- Moving averages
These tools can assist in identifying potential entry and exit points.
Bitcoin Investment Strategies for Long-Term Success
There is no one-size-fits-all strategy. Investors should choose an approach aligned with their goals and risk tolerance.
Buy and Hold Strategy
This is one of the most popular Bitcoin investment strategies.
Investors purchase Bitcoin and hold it for years, believing its long-term value will continue to grow.
Benefits include:
- Reduced trading stress
- Lower transaction costs
- Simplicity
- Long-term growth potential
Dollar Cost Averaging (DCA)
Dollar Cost Averaging involves investing a fixed amount regularly regardless of market price.
Benefits include:
- Reduces emotional investing
- Minimizes timing risk
- Builds disciplined investing habits
Many experienced investors prefer DCA for long-term Bitcoin accumulation.
Portfolio Diversification
Bitcoin should be part of a balanced investment portfolio.
Diversification can help reduce overall investment risk while maintaining growth opportunities.
Risk Management in Bitcoin Investing
One of the most important aspects of bitcoin education for investors is risk management.
Never Invest More Than You Can Afford to Lose
Bitcoin remains a high-risk asset.
Investors should only allocate funds they are comfortable holding through market volatility.
Set Clear Investment Goals
Ask yourself:
- Are you investing for retirement?
- Wealth growth?
- Portfolio diversification?
- Long-term capital appreciation?
Clear goals improve decision-making.
Avoid Emotional Trading
Fear and greed are responsible for many investment mistakes.
Successful investors typically:
- Follow a plan
- Ignore short-term noise
- Focus on long-term objectives
Use Secure Storage Solutions
Protecting Bitcoin is just as important as buying it.
Investors should learn about:
- Hardware wallets
- Cold storage
- Two-factor authentication
- Private key management
Security education can prevent significant losses.
Common Bitcoin Investing Mistakes to Avoid
Even experienced investors make mistakes.
H3: Investing Based on Hype
Social media trends and viral headlines often create unrealistic expectations.
Always conduct independent research before investing.
Trying to Time the Market
Predicting exact market tops and bottoms is extremely difficult.
Many investors achieve better results through disciplined investing rather than constant trading.
Ignoring Risk Management
Risk management should never be an afterthought.
A strong investment strategy includes position sizing, diversification, and security measures.
Neglecting Continuous Education
The cryptocurrency industry evolves rapidly.
Successful investors continue learning about:
- Market developments
- Regulatory changes
- New technologies
- Investment opportunities
How Institutional Adoption Is Changing Bitcoin Investing
Institutional adoption has significantly influenced Bitcoin’s growth.
Large organizations, investment funds, and corporations increasingly view Bitcoin as a legitimate asset class.
Benefits of institutional participation include:
- Increased market credibility
- Higher liquidity
- Greater adoption
- Enhanced infrastructure development
As adoption continues, investors who understand market dynamics may be better positioned to identify opportunities.
The Future of Bitcoin Education for Investors
As cryptocurrency adoption expands, investor education will become even more important.
Future trends include:
- Improved educational platforms
- Increased regulatory clarity
- Enhanced investment tools
- Greater institutional participation
- Mainstream financial integration
Investors who prioritize learning today may gain a significant advantage as the market evolves.
Frequently Asked Questions
What is bitcoin education for investors?
Bitcoin education for investors involves learning about Bitcoin, blockchain technology, market analysis, risk management, security, and investment strategies to make informed decisions.
Why is Bitcoin education important before investing?
Education helps investors understand risks, avoid common mistakes, improve decision-making, and develop effective long-term investment strategies.
Is Bitcoin suitable for beginner investors?
Bitcoin can be suitable for beginners who take time to learn the fundamentals and invest responsibly according to their risk tolerance.
What is the safest Bitcoin investment strategy?
Many investors consider Dollar Cost Averaging (DCA) one of the safer strategies because it reduces market timing risk and promotes consistent investing.
H3: How much Bitcoin should a beginner buy?
There is no universal amount. Investors should only invest money they can afford to hold long term and potentially lose without affecting financial stability.
Can Bitcoin be part of a diversified portfolio?
Yes. Many investors use Bitcoin as a diversification asset alongside stocks, bonds, and other investments.
Where can I learn more about Bitcoin investing?
Reliable educational resources, professional market analysis, and trusted cryptocurrency research platforms can help investors build knowledge and confidence.
Conclusion: Build Your Bitcoin Knowledge Before You Invest
The cryptocurrency market offers exciting opportunities, but success starts with education. Understanding Bitcoin fundamentals, investment strategies, risk management principles, and market behavior can help investors make smarter decisions and avoid costly mistakes.
At The Crypto Investors, we believe informed investors make better investors. Our mission is to provide actionable cryptocurrency insights, market analysis, Bitcoin investment education, and expert guidance that helps you navigate the digital asset landscape with confidence.
Whether you’re taking your first steps into Bitcoin or refining your long-term investment strategy, our resources are designed to help you stay informed, manage risk, and identify opportunities in an evolving market.
Explore The Crypto Investors today and take your Bitcoin investing journey to the next level with trusted education, expert insights, and practical investment knowledge.
Bitcoin On-Chain Indicators for Beginners: A Simple Guide to Understanding Bitcoin Market Trends
Bitcoin On-Chain Indicators for Beginners: A Simple Guide
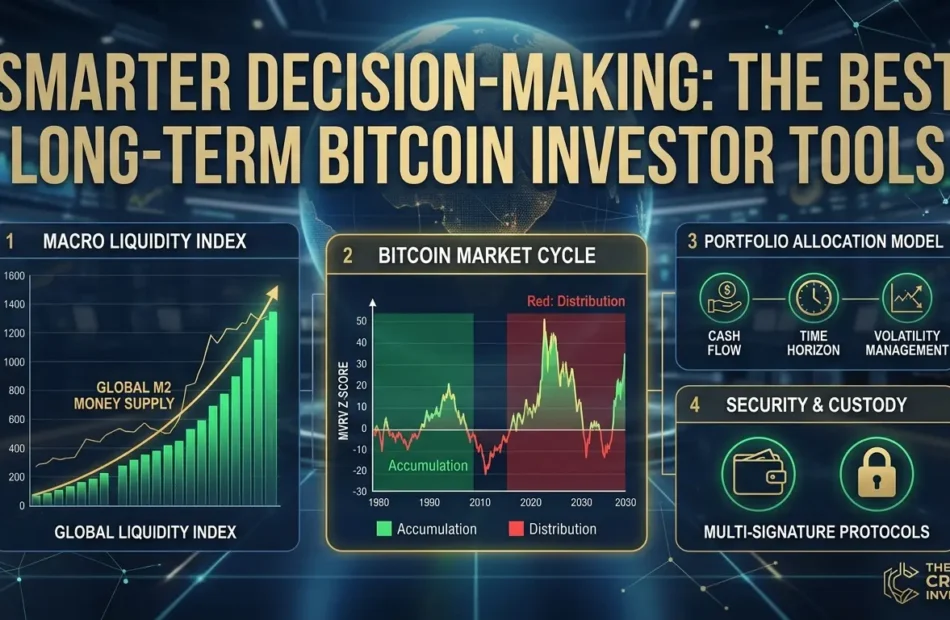
Bitcoin on-chain indicators for beginners: Bitcoin is the only major asset class that allows investors to study market behavior directly from the blockchain. Unlike traditional markets, Bitcoin transactions are publicly recorded, making it possible to track investor sentiment, network activity, and potential market trends.
If you’re new to Bitcoin investing, understanding on-chain indicators can help you make more informed decisions. In this beginner-friendly guide, we’ll explain the most important Bitcoin on-chain indicators and how you can use them without getting overwhelmed.
What Are Bitcoin On-Chain Indicators?
Bitcoin on-chain indicators are metrics derived from blockchain data. They help investors analyze how Bitcoin holders behave, how coins move across the network, and whether the market may be overheated or undervalued.
Because Bitcoin operates on a transparent ledger, anyone can access this data and use it to gain insights into market conditions.
Why On-Chain Analysis Matters
- Reveals investor behavior.
- Identifies accumulation and distribution phases.
- Helps understand long-term market cycles.
- Provides data-driven insights beyond price charts.
MVRV Ratio (Market Value to Realized Value)
The MVRV Ratio compares Bitcoin’s market value with its realized value.
What It Tells Investors
- High MVRV levels can indicate that many holders are in profit, increasing the risk of selling pressure.
- Lower MVRV levels may suggest undervaluation opportunities.
Historically, extreme MVRV readings have coincided with major Bitcoin cycle turning points.
SOPR (Spent Output Profit Ratio)
SOPR measures whether investors are selling Bitcoin at a profit or a loss.
How Beginners Can Use SOPR
- SOPR above 1 indicates coins are being sold in profit.
- SOPR below 1 suggests investors are realizing losses.
This metric helps identify shifts in market sentiment.
Exchange Inflows and Outflows
Exchange flow data tracks Bitcoin moving into or out of exchanges.
What Exchange Flows Mean
- Increasing exchange inflows may indicate potential selling activity.
- Large exchange outflows often suggest long-term holding behavior.
Many investors monitor exchange reserves to understand supply dynamics.
Active Addresses
Active addresses represent the number of unique Bitcoin addresses participating in transactions.
Why This Metric Matters
- Rising active addresses can signal growing network adoption.
- Declining activity may indicate reduced market participation.
However, this indicator works best when combined with other metrics.
Long-Term Holder Supply
Long-term holders are wallets that have held Bitcoin for extended periods without moving coins.
What It Reveals
- Increasing long-term holder supply may suggest confidence among experienced investors.
- Decreasing supply can indicate profit-taking.
This metric is widely used in Bitcoin cycle analysis.
Common Mistakes Beginners Should Avoid
Relying on One Indicator
No single metric predicts market tops or bottoms perfectly.
Ignoring Market Context
Macroeconomic conditions and institutional flows also influence Bitcoin prices.
Chasing Short-Term Signals
Most on-chain indicators are more effective for medium- and long-term analysis rather than daily trading decisions.
Tools to Track Bitcoin On-Chain Indicators
Popular Platforms
- Glassnode
- CryptoQuant
- Coin Metrics
- The Crypto Investors Dashboard
These platforms simplify blockchain data into visual charts that are easier for beginners to understand
Frequently Asked Questions (FAQs)
What are Bitcoin on-chain indicators?
Bitcoin on-chain indicators are metrics derived from blockchain data that help investors analyze market behavior and network activity.
Which Bitcoin on-chain indicator is best for beginners?
MVRV Ratio and exchange flow data are among the easiest indicators for beginners to understand.
Are on-chain indicators accurate?
They provide valuable insights but should not be used in isolation. Combining multiple indicators improves decision-making.
Can on-chain indicators predict Bitcoin prices?
No indicator can predict prices with certainty. They are tools used to assess probabilities and market conditions.
Where can I track Bitcoin on-chain metrics?
Platforms such as Glassnode, CryptoQuant, Coin Metrics, and The Crypto Investors offer access to on-chain data dashboards.
Conclusion:
Understanding Bitcoin on-chain indicators can give beginners a clearer picture of what is happening beneath the surface of the market. Metrics like MVRV, SOPR, exchange flows, active addresses, and long-term holder supply offer valuable insights that go beyond traditional price charts. While no indicator guarantees success, combining on-chain analysis with sound risk management can help investors make more informed decisions.
At The Crypto Investors, we are committed to helping Bitcoin investors navigate the market through educational resources, market insights, and data-driven strategies. Whether you are just beginning your Bitcoin journey or looking to strengthen your investment approach, visit https://thecryptoinvestors.com/ to explore tools and resources designed to support smarter investing.

How to Use Accordions and Toggles for Better User Experience
Why Use Accordions and Toggles for Better User Experience?
Accordions and toggles improve user experience by presenting information in a structured and organized way. Instead of displaying large blocks of text, these elements allow users to access only the content they need, reducing visual clutter and making pages easier to navigate.
Key Benefits of Accordions and Toggles
1. Improve Content Organization
They break down complex information into manageable sections, helping users find relevant details quickly.
2. Enhance Mobile Experience
With limited screen space on mobile devices, accordions and toggles prevent excessive scrolling and create a cleaner interface.
3. Increase User Engagement
Interactive elements encourage users to explore additional content, leading to better engagement and longer session durations.
4. Reduce Cognitive Overload
Displaying too much information at once can overwhelm visitors. Collapsible sections allow users to process information at their own pace.
5. Improve FAQ Pages
Accordions are commonly used on FAQ pages to organize answers efficiently, making it easier for visitors to locate specific information.
Accordions vs. Toggles
| Feature | Accordions | Toggles |
|---|---|---|
| Open Sections | Usually one at a time | Multiple sections can remain open |
| Best Use Case | FAQs and step-by-step guides | Settings panels and detailed content |
| Space Efficiency | High | Moderate |
| User Control | Limited | Greater flexibility |
Key Takeaways
- Use accordions when content needs to remain concise and organized.
- Use toggles when users may need to compare multiple sections simultaneously.
- Avoid hiding essential information that users need immediately.
- Ensure accessibility by providing clear labels and intuitive navigation.
When implemented thoughtfully, accordions and toggles can significantly improve usability while maintaining a clean and professional website design.
How to Implement Accordions and Toggles Effectively
Using accordions and toggles correctly can significantly improve user experience. However, poor implementation may frustrate visitors and make important information harder to access. Following a strategic approach ensures these elements enhance usability rather than hinder it.
Step-by-Step Guide to Using Accordions and Toggles
1. Identify Content That Can Be Collapsed
Not all content should be hidden. Use accordions and toggles for:
- Frequently Asked Questions (FAQs)
- Product specifications
- Help center articles
- Policy information
- Step-by-step instructions
Avoid placing critical information that users need immediately behind expandable sections.
2. Choose the Right Component
Use accordions when:
- Only one section needs to be open at a time.
- Space-saving is a priority.
- Users typically focus on one topic before moving to the next.
Use toggles when:
- Users may need to view multiple sections simultaneously.
- Content comparison is important.
- Greater flexibility is required.
3. Write Clear and Descriptive Headings
The labels used for accordion and toggle sections should clearly communicate what users will find inside. Avoid vague titles such as “More Information.”
Good examples:
- Shipping and Delivery Information
- Account Security Settings
- Frequently Asked Questions
4. Prioritize Accessibility
Ensure that all users, including those using assistive technologies, can interact with the content effectively.
Best practices include:
- Using keyboard-friendly navigation
- Providing clear focus indicators
- Maintaining sufficient contrast ratios
- Ensuring screen reader compatibility
5. Test on Different Devices
A design that works well on desktops may not perform equally well on mobile devices. Review the user experience across various screen sizes to confirm that interactions remain intuitive.
Common Mistakes to Avoid
- Hiding essential information users need immediately.
- Overusing accordions throughout the entire page.
- Using unclear or misleading section labels.
- Ignoring accessibility requirements.
- Failing to test functionality on mobile devices.
Practical Example
An e-commerce website can use accordions to organize product details such as specifications, return policies, and customer support information. This approach reduces clutter while still giving users easy access to the content they need before making a purchase decision.
Best Practices at a Glance
- Keep section titles concise and descriptive.
- Limit the number of expandable sections.
- Make interactions predictable and consistent.
- Test for usability and accessibility.
- Prioritize the user’s needs over design trends.
When used strategically, accordions and toggles create a more streamlined and engaging experience, helping users navigate information efficiently without feeling overwhelmed.
Frequently Asked Questions (FAQs)
1. What are accordions and toggles in web design?
Accordions and toggles are interactive UI elements that allow users to expand or collapse content sections, improving content organization and usability.
2. What is the difference between accordions and toggles?
Accordions typically allow only one section to remain open at a time, while toggles enable multiple sections to stay expanded simultaneously.
3. Do accordions improve user experience?
Yes. When used correctly, accordions reduce visual clutter, improve navigation, and help users find relevant information more efficiently.
4. Are accordions and toggles mobile-friendly?
Absolutely. These elements are especially useful on mobile devices because they save screen space and minimize excessive scrolling.
5. Are accordions good for SEO?
Yes. Search engines can index content within accordions as long as the content is accessible in the page’s HTML and provides value to users.
6. Where should accordions be used?
Accordions work well for FAQs, product details, support documentation, policy pages, and step-by-step guides.
7. Can too many accordions hurt usability?
Yes. Overusing accordions may hide important information and frustrate users. They should be used strategically.
8. What are the accessibility considerations for accordions?
Accessible accordions should support keyboard navigation, screen readers, clear labels, and proper focus indicators.
9. When should I use toggles instead of accordions?
Use toggles when users may need to view multiple content sections simultaneously for comparison or reference.
10. What are the best practices for using accordions and toggles?
Keep headings descriptive, avoid hiding critical information, prioritize accessibility, and test functionality across devices.
Conclusion
Accordions and toggles are powerful design elements that can significantly enhance user experience when implemented thoughtfully. By organizing content into manageable sections, they improve readability, reduce cognitive overload, and help users navigate information more efficiently across both desktop and mobile devices.
The key to success lies in using these components strategically. Focus on clarity, accessibility, and user intent rather than simply following design trends. When applied correctly, accordions and toggles can contribute to higher engagement, improved usability, and a more intuitive browsing experience.
As digital experiences continue to evolve, understanding the principles of effective interface design remains essential for website owners, designers, and developers alike. For more insights on cryptocurrency investing, market trends, Bitcoin cycle analysis, and educational resources designed for long-term investors, explore TheCryptoInvestors.com, a platform dedicated to helping investors make informed decisions through data-driven intelligence and market awareness.
Content Goal
The goal of this article is to educate readers on how accordions and toggles can be used effectively to improve user experience. By providing practical guidance, implementation strategies, and best practices, this content aims to help businesses, designers, and website owners create more user-friendly digital experiences. Additionally, the article is optimized for Google AI Overviews and featured snippets while maintaining a strong focus on readability, usability, and real-world value.

How to Read Bitcoin Market Cycles: Complete Guide
How to Read Bitcoin Market Cycles: Complete Guide
Learning how to read Bitcoin market cycles involves understanding the recurring phases of accumulation, markup, distribution, and markdown. By analyzing these stages alongside market indicators and investor sentiment, you can make more informed cryptocurrency investment decisions.
Quick Summary
Bitcoin does not move in a straight line. Instead, it follows cycles influenced by supply and demand, investor psychology, macroeconomic factors, and Bitcoin halving events. Understanding these cycles can help investors manage risk and identify potential opportunities.
Key Takeaways
- Bitcoin market cycles generally consist of four phases.
- Investor emotions often drive price movements.
- Halving events can significantly impact market trends.
- On-chain metrics provide valuable market insights.
- Long-term strategies typically outperform emotional decisions.
What Are Bitcoin Market Cycles?
Bitcoin market cycles refer to the recurring patterns of price growth and decline that occur over time. These cycles reflect changing investor sentiment, market conditions, and Bitcoin’s supply dynamics.
While no cycle is identical, understanding past patterns can help investors better interpret current market behavior.
Why Do Bitcoin Market Cycles Occur?
Several factors contribute to Bitcoin’s cyclical nature:
- Investor psychology.
- Bitcoin halving events.
- Market liquidity.
- Institutional participation.
- Global economic conditions.
- Media coverage and public sentiment.
These forces interact to create periods of optimism and pessimism.
The Four Phases of Bitcoin Market Cycles
Understanding these phases is essential if you want to know how to read Bitcoin market cycles effectively.
1. Accumulation Phase
The accumulation phase typically occurs after a prolonged market decline.
Characteristics:
- Prices stabilize.
- Market sentiment remains negative.
- Experienced investors gradually accumulate Bitcoin.
- Trading volumes are relatively low.
Many long-term investors view this phase as an opportunity.
2. Markup Phase
The markup phase marks the beginning of a sustained upward trend.
Characteristics:
- Higher highs and higher lows emerge.
- Positive sentiment increases.
- Media attention grows.
- New investors enter the market.
Historically, this phase has generated substantial returns.
3. Distribution Phase
During distribution, early investors begin taking profits.
Characteristics:
- Prices become highly volatile.
- Market enthusiasm peaks.
- Valuation concerns increase.
- Institutional selling may occur.
This phase often signals that the market is approaching a turning point.
4. Markdown Phase
The markdown phase represents a broader market correction.
Characteristics:
- Prices decline significantly.
- Investor confidence weakens.
- Fear dominates decision-making.
- Trading activity decreases.
Although challenging emotionally, this phase lays the foundation for future accumulation.
How to Read Bitcoin Market Cycles Using Key Indicators
Bitcoin Halving Events
Bitcoin halvings reduce the rate at which new Bitcoin enters circulation.
Historically, halvings have influenced long-term price trends by affecting supply dynamics. While past performance does not guarantee future outcomes, many investors monitor these events closely.
On-Chain Metrics
On-chain data can provide valuable insights into market conditions.
Common metrics include:
- Long-term holder behavior.
- Exchange inflows and outflows.
- Realized profit and loss indicators.
- Network activity trends.
These metrics help investors assess underlying market strength.
Technical Analysis Indicators
Technical tools may assist in identifying broader trends.
Popular indicators include:
- Moving averages.
- Relative Strength Index (RSI).
- Volume analysis.
- Support and resistance levels.
These indicators should complement—not replace—fundamental analysis.
Market Sentiment
Investor sentiment frequently influences Bitcoin price movements.
Signs of extreme optimism or excessive fear can sometimes indicate potential market turning points.
Common Mistakes Investors Make
Chasing Market Hype
Entering positions solely because others are buying often leads to poor outcomes.
Panic Selling
Short-term volatility may trigger emotional decisions that conflict with long-term objectives.
Ignoring Risk Management
Every investment strategy should include clear risk parameters.
Expecting Perfect Predictions
No indicator can consistently predict market tops and bottoms with certainty.
Practical Tips for Navigating Bitcoin Market Cycles
- Focus on long-term goals.
- Develop a disciplined investment plan.
- Avoid making decisions based solely on emotions.
- Diversify your overall portfolio.
- Continue educating yourself about market developments.
- Review your investment strategy periodically.
Consistency often proves more effective than attempting to time every market movement.
Frequently Asked Questions
1. What are Bitcoin market cycles?
Bitcoin market cycles are recurring periods of growth and decline influenced by supply, demand, and investor behavior.
2. How long do Bitcoin market cycles last?
Cycle durations vary, although many investors reference Bitcoin’s historical four-year pattern linked to halving events.
3. What is the accumulation phase?
The accumulation phase occurs after market declines when experienced investors gradually build positions.
4. How do halving events affect Bitcoin?
Halvings reduce new Bitcoin supply, which may influence long-term market dynamics.
5. Can technical analysis predict Bitcoin cycles?
Technical analysis can identify trends but cannot predict future outcomes with certainty.
6. Is investor psychology important?
Yes. Fear and greed often contribute significantly to market movements.
7. Should beginners study Bitcoin cycles?
Understanding market cycles can help beginners develop realistic expectations and stronger investment discipline.
8. Are Bitcoin cycles guaranteed to repeat?
No. Historical patterns offer insights, but future market conditions may differ.
9. Can market cycles help reduce investment risk?
Recognizing different phases may improve decision-making and support better risk management practices.
10. What is the best way to learn Bitcoin market cycles?
Combining historical analysis, educational resources, and ongoing market observation can strengthen understanding over time.
Conclusion
Understanding how to read Bitcoin market cycles can help investors navigate volatility with greater confidence. By recognizing the phases of accumulation, markup, distribution, and markdown, investors can develop more disciplined strategies and avoid emotional decision-making.
At The Crypto Investors, we aim to provide reliable cryptocurrency education, market insights, and practical investment knowledge to help readers make informed decisions in the ever-evolving digital asset landscape.
Disclaimer: This content is intended for educational purposes only and should not be considered financial advice. Always conduct independent research before making investment decisions.